"Your Prometheus fell over," the interviewer said, "and the only thing that changed was a new label on one metric." The candidate said a single label couldn't matter. The label was user_id. With two hundred thousand users, one metric had just become two hundred thousand time series, and the memory graph looked like a cliff face.
Cardinality is the thing Prometheus interview questions circle back to, because it is the failure mode that takes down monitoring at exactly the moment you need it. This guide covers the pull model, the four metric types, the PromQL that actually gets asked, alerting, and the cardinality trap.
What Prometheus interviews actually test
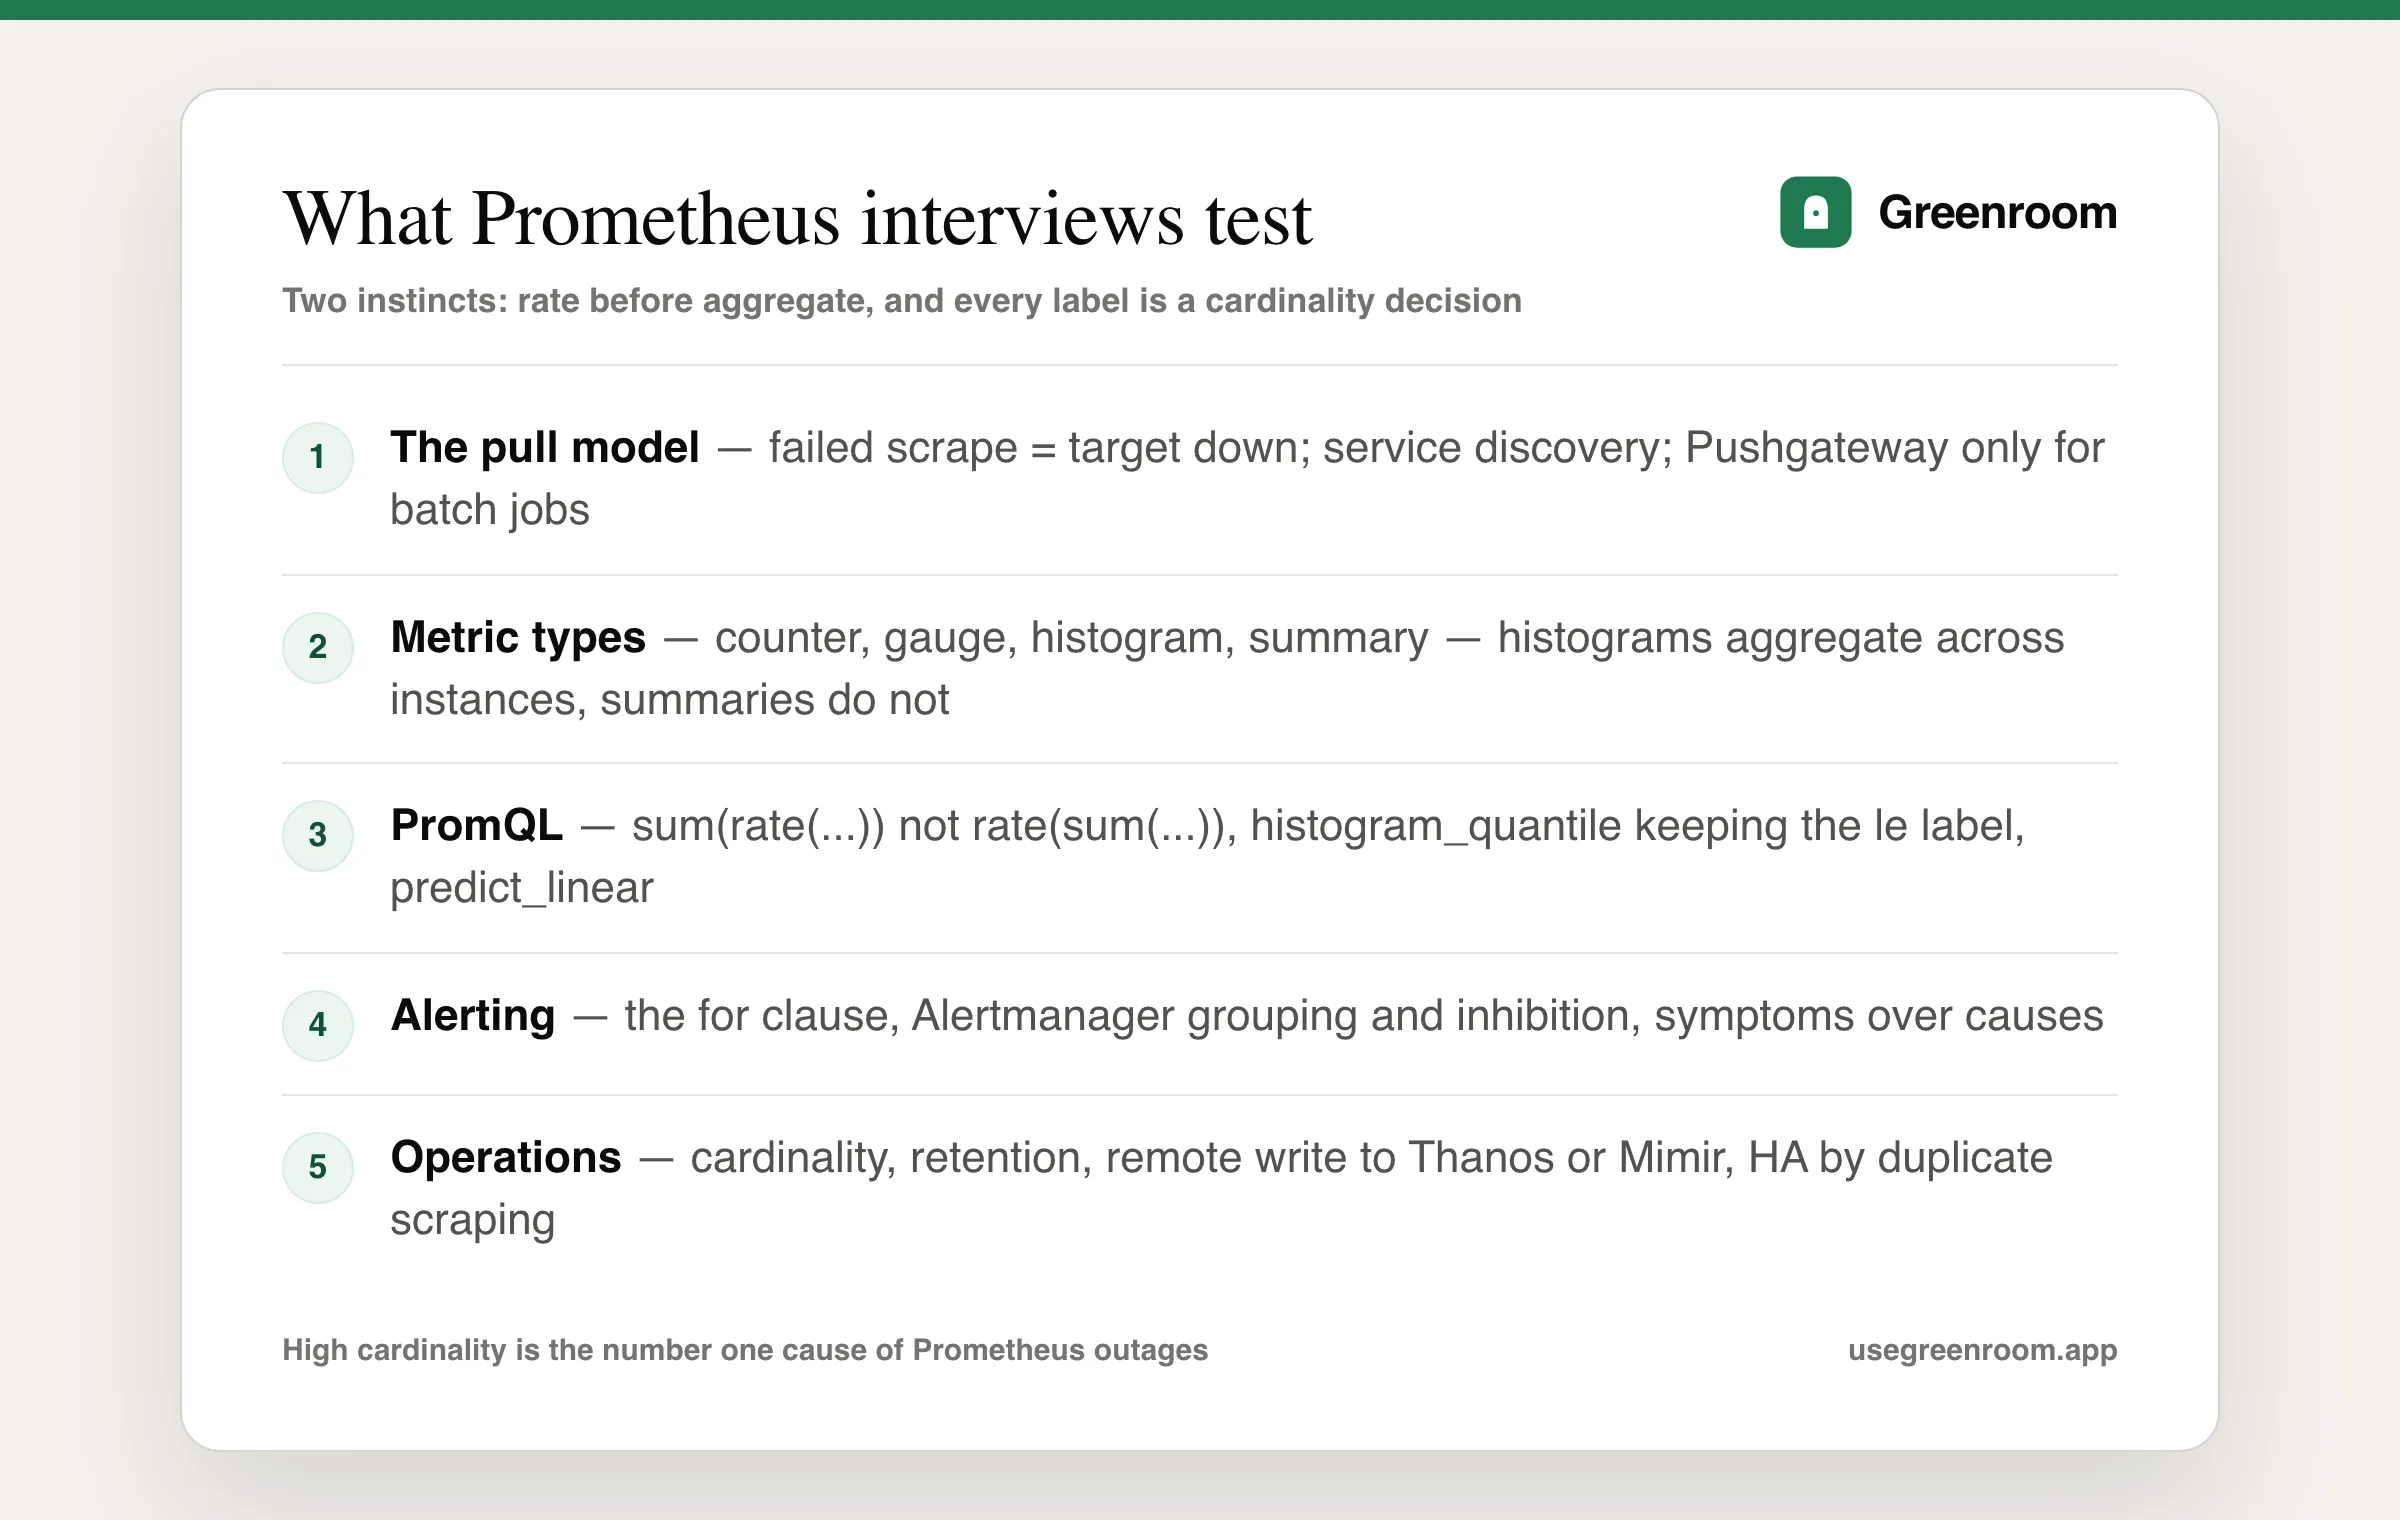
Prometheus interview questions appear in DevOps, SRE and platform loops. Five bands:
- The architecture — pull vs push, service discovery, storage, and why it works that way.
- Metric types — counter, gauge, histogram, summary, and choosing correctly.
- PromQL —
rate, aggregation, and histogram quantiles. The band that separates candidates. - Alerting — rules,
forduration, Alertmanager, and what makes a good alert. - Operations — cardinality, retention, federation, long-term storage.
The pull model and architecture
The opener is usually "why does Prometheus pull instead of push?" The reasons, and a complete answer gives several:
- Target health comes free — if a scrape fails, the target is down. With push, silence is ambiguous: is the service dead, or just not sending?
- No accidental self-DDoS — Prometheus controls the scrape rate rather than being overwhelmed by clients.
- Easy local testing — a
/metricsendpoint you can curl. - Service discovery integrates naturally — Kubernetes, Consul or EC2 tells Prometheus what exists, so targets appear and disappear automatically.
Then the honest exception, which interviewers like to hear: short-lived batch jobs may finish before any scrape, which is what the Pushgateway is for — and the caveat that it should be used only for that, because using it generally re-creates all the problems of push and turns Prometheus into a single point of staleness.
Know the surrounding pieces: exporters translate third-party systems into Prometheus metrics (node_exporter for hosts, blackbox_exporter for probes), Prometheus stores samples in a local time-series database designed for this shape, and it is explicitly not built for long-term retention or global querying — that is what Thanos, Cortex and Mimir add. Saying "Prometheus is a monitoring system, not a durable metrics warehouse" reads as experienced.
Metric types and choosing correctly
- Counter — only goes up, resets to zero on restart. Requests served, errors, bytes sent. Never graph a counter raw; always wrap it in
rate(). - Gauge — goes up and down. Memory in use, queue depth, active connections, temperature.
- Histogram — samples bucketed into configurable ranges, exposed as cumulative
_bucketcounters plus_sumand_count. Quantiles are computed at query time, which means they can be aggregated across instances. - Summary — quantiles calculated client-side. Cheaper to query but not aggregatable: you cannot average the 99th percentile of three instances and get a meaningful number.
The histogram-versus-summary question is asked constantly, and the answer is that distinction: if you need percentiles across multiple instances, use a histogram. Being able to explain why averaging percentiles is mathematically meaningless is the strongest version of this answer.
PromQL: the queries that actually get asked
Expect to write these on a whiteboard:
# Per-second request rate over 5m, summed by service
sum(rate(http_requests_total[5m])) by (service)

# Error ratio — note rate() goes INSIDE sum(), never the other way round
sum(rate(http_requests_total{status=~"5.."}[5m])) by (service)
  / sum(rate(http_requests_total[5m])) by (service)

# p99 latency from a histogram, aggregated across instances
histogram_quantile(0.99,
  sum(rate(http_request_duration_seconds_bucket[5m])) by (le, service))

# Disk will fill within 4h, based on the last 6h trend
predict_linear(node_filesystem_avail_bytes{mountpoint="/"}[6h], 4 * 3600) < 0
The details interviewers check:
ratevsiratevsincrease—rateis the average per-second rate over the window and is what you almost always want;irateuses only the last two samples and is too jumpy for alerts;increaseis total growth over the window (and is justrate× seconds).ratemust wrap the counter directly.rate(sum(...))is wrong because summing across counters that reset independently destroys the reset detection.sum(rate(...))is correct. This is the single most common PromQL mistake and a favourite question.- The
lelabel must survive aggregation inhistogram_quantile, which is whyby (le, service)appears — droppingleis a classic bug. - Window size should be at least four times the scrape interval so a window always contains enough samples.
Alerting and what makes an alert good
Alerting rules live in Prometheus and evaluate PromQL on a schedule; Alertmanager handles what happens next — grouping related alerts into one notification, inhibition (suppress node-level alerts when the whole cluster is down), silencing during maintenance, and routing to the right destination.
The for clause is the most-asked detail: an alert fires only if the condition stays true for that duration, which stops a single scrape blip paging someone at 3am. Explaining that is a quick credibility win.
Then the judgment question — "what makes a good alert?" The expected answer, and it is really an SRE answer: alert on symptoms users experience, not on causes. High error rate and high latency are symptoms; CPU at 90% is a cause that may be entirely fine. Every alert should be actionable and have a runbook; anything that fires regularly and gets ignored should be deleted, because alert fatigue is a bigger operational risk than a missing alert. Mention the four golden signals — latency, traffic, errors, saturation — and burn-rate alerting against an SLO. Our SRE interview questions guide goes deeper.
Cardinality, retention and scaling
Back to the user_id label. A time series is uniquely identified by its metric name plus its full label set, so every distinct label value combination is a separate series, each with its own memory and index cost. Cardinality multiplies: 5 endpoints × 10 status codes × 3 instances is 150 series, which is fine — add user ID or request ID or a raw URL with path parameters and it explodes.
So the rules to state: never use unbounded values as labels (user IDs, email addresses, session IDs, full URLs, timestamps); template path parameters into a route label (/users/{id}, not /users/12345); and use topk on series counts plus the TSDB status page to find offenders. Say explicitly that high cardinality is the number one cause of Prometheus outages.
On scale: retention is time- and size-bounded locally, so long-term storage means remote write to Thanos, Cortex or Mimir. Federation lets one Prometheus scrape aggregated metrics from others, but hierarchical federation is a partial answer and modern setups prefer remote write. High availability is usually two identical Prometheus servers scraping the same targets, deduplicated downstream — because Prometheus itself is not clustered.
The docs, Grafana, ChatGPT — where each fits
- The official Prometheus documentation — the querying basics and best-practices pages answer most interview questions, particularly the naming and label conventions.
- Google's SRE Book — free online, and the source of the symptom-based alerting and golden-signals reasoning that senior rounds probe.
- Running the stack locally — highest yield. Prometheus, node_exporter and Grafana in Docker Compose, then instrument a small app and write the four queries above by hand.
- Deliberately blowing up cardinality — add a high-cardinality label to a test instance and watch memory climb. That experience makes the hardest question concrete.
- Grafana — worth knowing as the visualisation half, since interviewers often ask about them together; but the queries are PromQL, so PromQL is what to practise.
- ChatGPT — good for drafting queries and explaining functions. It will not point at your new label and ask how many distinct values it has.
- Greenroom — the spoken layer. Ari, the AI interviewer, runs monitoring and incident rounds out loud and pushes when your alerting answer lacks a reason. Fair tradeoff: Ari will not query your TSDB.
rate() before aggregating, and treating every label as a cardinality decision. Both are the difference between monitoring that survives an incident and monitoring that causes one.How to prepare for a Prometheus interview
- Week 1: architecture and metric types. Run the stack locally, instrument an app with all four types, and justify each choice aloud.
- Week 2: PromQL daily. Write rate, error ratio, and histogram quantile queries from memory, and explain why
sum(rate(...))is notrate(sum(...)). - Week 3: alerting. Write rules with sensible
fordurations, configure Alertmanager grouping and inhibition, and prepare the symptom-versus-cause argument. - Final week: operations — cause a cardinality explosion, find it with
topk, then run two full spoken mocks with incident follow-ups.
Building the rest of the stack? The Kubernetes guide covers the platform Prometheus usually monitors, the Nginx guide covers the proxy layer, the Ansible guide covers configuration management, and the DevOps engineer guide covers the wider loop.
For the broader round this tool sits inside, see our observability interview questions and answers guide.
Frequently asked questions
What are the most common Prometheus interview questions?
The most common questions cover why Prometheus pulls rather than pushes and when the Pushgateway is appropriate, the four metric types and when to use a histogram instead of a summary, writing PromQL for request rate, error ratio and p99 latency, why rate must be applied before aggregation rather than after, what the for clause does in an alerting rule, and what causes high cardinality and why it takes Prometheus down.
Why does Prometheus use a pull model instead of push?
Pulling means a failed scrape immediately indicates the target is down, whereas silence in a push system is ambiguous. It also lets Prometheus control the scrape rate rather than being overwhelmed, makes targets trivially testable by curling a metrics endpoint, and integrates naturally with service discovery so targets appear and disappear automatically. The exception is short-lived batch jobs that may finish before any scrape, which is what the Pushgateway exists for.
What is the difference between a histogram and a summary in Prometheus?
A histogram buckets observations into configurable ranges and exposes cumulative bucket counters, so quantiles are calculated at query time with histogram_quantile and can be aggregated across instances. A summary calculates quantiles on the client, which is cheaper to query but cannot be aggregated — averaging the 99th percentile from three instances produces a meaningless number. If you need percentiles across multiple instances, use a histogram.
What is the difference between rate, irate and increase in PromQL?
rate calculates the average per-second rate of increase over a time window and is what you almost always want for graphs and alerts. irate uses only the last two samples, making it very responsive but too jumpy for alerting. increase returns the total growth over the window and is equivalent to rate multiplied by the window in seconds. All three handle counter resets correctly, which is why you never graph a raw counter.
Why must rate be applied before sum in PromQL?
rate needs to see each individual counter series to detect resets, which happen when a process restarts. If you sum several counters first, an individual reset appears as a sudden drop in the summed series and rate misinterprets the data. So sum(rate(metric[5m])) is correct and rate(sum(metric)[5m]) is wrong. This is the single most common PromQL mistake and a frequent interview question.
What causes high cardinality in Prometheus and why does it matter?
A time series is uniquely identified by its metric name plus its complete label set, so every distinct combination of label values creates a separate series with its own memory and index cost. Using unbounded values as labels — user IDs, session IDs, email addresses, full URLs with path parameters, or timestamps — multiplies series counts into the hundreds of thousands and exhausts memory. High cardinality is the leading cause of Prometheus outages.