There is a very specific kind of silence that happens when a hiring manager shares their screen, opens a spreadsheet with 40,000 rows of regional sales data, and says: "Take a few minutes, then walk me through how you'd find the top three underperforming products by region." You have used Excel for six years. You have built dashboards. And in this exact moment, your brain produces nothing except the faint, ambient memory of a keyboard shortcut you used once in 2021.
This is the Excel interview in its natural habitat — not a multiple-choice quiz about cell references, but a live, screen-shared, slightly adversarial test of whether you can actually move through real data under mild social pressure. Data analyst and business analyst roles run this gauntlet constantly, because Excel is still the lingua franca of every finance team, ops team, and "can someone just send me the numbers" Slack thread on earth, regardless of how much a job description name-drops Tableau or Power BI underneath it.
The good news: the actual skill set being tested is narrow and learnable. VLOOKUP/XLOOKUP, INDEX-MATCH, pivot tables, a handful of formulas (SUMIFS, COUNTIFS, IFERROR), some data cleaning instincts, and the ability to narrate your own thinking out loud. That's the whole test, dressed up in different spreadsheets every time. This guide covers all of it — plus how to survive the live skills test format, and how Excel stacks up against the other tools that might be on your interview slate.
Why Excel still gets its own interview round in 2026
Here's the thing nobody puts in the job posting: most companies do not run on a perfectly governed data warehouse with self-serve BI tools and clean semantic layers. Most companies run on a shared drive with seventeen files named Q3_Forecast_FINAL_v3_actual_final.xlsx, and somebody — often the person being interviewed right now — is expected to be the one who can open that file and not flinch.
Excel interview rounds exist for three blunt reasons: it's the fastest way to test real analytical instinct (a pivot table prompt reveals in ninety seconds whether you think in rows-and-aggregations, the same way a SQL GROUP BY does); it's still the actual job, half the time, in finance, ops and sales analytics; and it filters resume inflation — "Advanced Excel" is the most over-claimed line on every analyst resume on the planet, and a two-minute live test separates the people who can actually build a pivot table from the people who once watched someone else build one.
If you're prepping for adjacent roles, two Greenroom guides pair well with this one: our business analyst interview questions guide covers the requirements-and-stakeholder side of the role, and our data analyst interview questions guide covers the SQL and statistics half of the same job. Excel questions usually show up as one round among several, not the whole interview.
VLOOKUP vs INDEX-MATCH vs XLOOKUP — the question that comes up every time
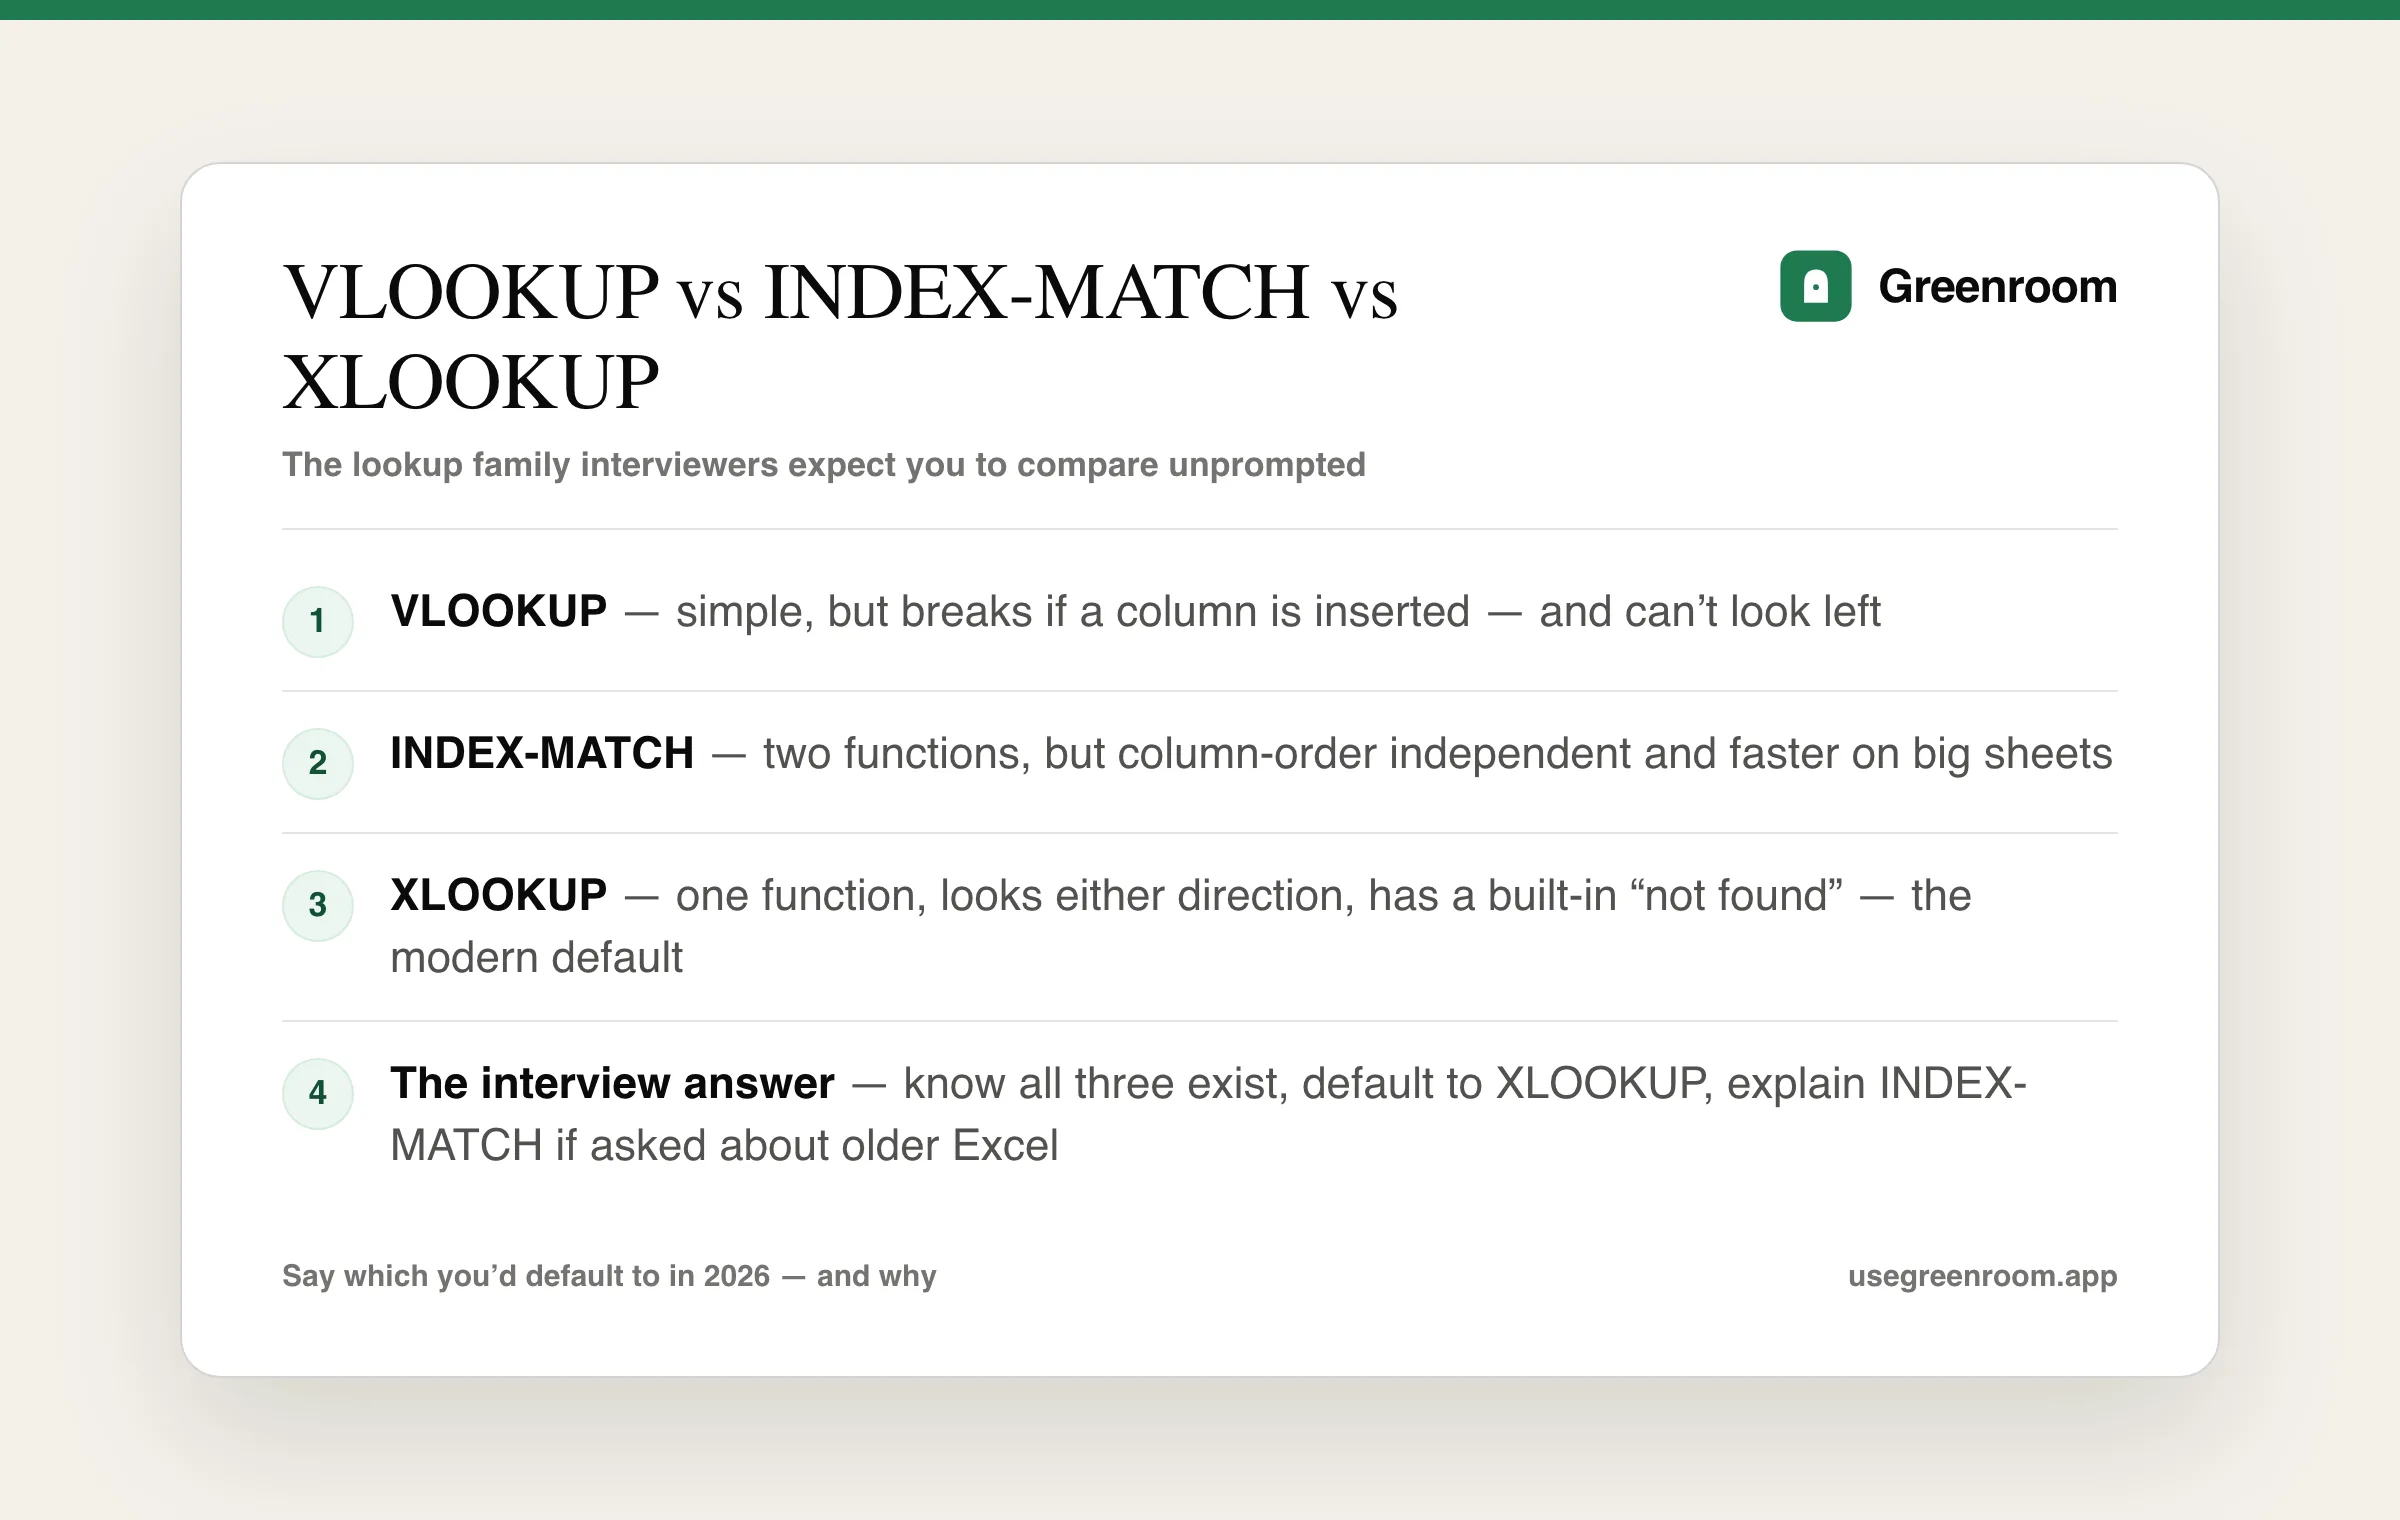
If an interviewer asks you exactly one Excel theory question, it is some version of: "What's the difference between VLOOKUP and INDEX-MATCH, and which do you use?" In 2026, the honest, complete answer also has to mention XLOOKUP, because pretending it doesn't exist makes you look out of date.
What does VLOOKUP do, and what's its biggest limitation?
VLOOKUP searches for a value in the leftmost column of a range and returns a value from a column to the right of it, in the same row.
VLOOKUP(lookup_value, table_array, col_index_num, [range_lookup])Example: you have an Employee ID in column A and want their Department from column D of a lookup table.
VLOOKUP(A2, EmployeeTable, 4, FALSE)The FALSE (or 0) at the end means "exact match" — leaving this out, or using TRUE, tells Excel to find the closest match, which is almost never what you want and is a classic source of silently wrong numbers.
VLOOKUP's real limitations, the ones an interviewer wants to hear: it can't look left — the value you're searching for must be in the first column of the range; it breaks when columns are inserted, because col_index_num is a hardcoded position, and inserting a column silently shifts every formula to pull from the wrong place with no error; and it's slower on large datasets than INDEX-MATCH, since it scans the full lookup column for every row.
What's the INDEX-MATCH combination, and why do some analysts prefer it?
INDEX-MATCH separates "where is the match" from "what do I return," using two functions together:
INDEX(return_range, MATCH(lookup_value, lookup_range, 0))Same example as above:
INDEX(EmployeeTable[Department], MATCH(A2, EmployeeTable[Employee ID], 0))Why analysts who learned Excel before 2022 default to this: it can look in any direction, since MATCH just returns a position and INDEX returns a value at that position; it's column-order independent — insert a column anywhere in the table and it still works; and it's measurably faster on big sheets.
What is XLOOKUP, and is it actually better?
XLOOKUP, introduced in Excel 365/2021 and now the default in most modern installs, is Microsoft's answer to "why do I need two functions for this":
XLOOKUP(lookup_value, lookup_array, return_array, [if_not_found])Same example, one function:
XLOOKUP(A2, EmployeeTable[Employee ID], EmployeeTable[Department], "Not found")XLOOKUP genuinely is the better default in 2026: one function instead of two, easier to read and audit; built-in "not found" handling without a separate IFERROR wrapper; and it searches either direction natively, defaulting to exact match — the safer default VLOOKUP doesn't have.
The answer that actually lands in an interview isn't "XLOOKUP is strictly better, full stop." It's something like: "I default to XLOOKUP when it's available, because it's cleaner and safer by default. I still reach for INDEX-MATCH on older files or shared templates that need to stay compatible with Excel versions before 365, and I know VLOOKUP well enough to read and fix it in legacy workbooks — which is most of what I actually inherit." That answer shows judgment, not just memorization.
Core formula questions: SUMIFS, COUNTIFS, IFERROR and friends
After the lookup question, interviewers move to conditional aggregation — because almost every real business question is some version of "sum/count X where Y is true."
How do SUMIF and SUMIFS differ?
SUMIF takes one condition. SUMIFS takes multiple conditions, and — this trips people up — the syntax order is reversed between them.
SUMIF(range, criteria, [sum_range])
SUMIFS(sum_range, criteria_range1, criteria1, [criteria_range2, criteria2], ...)
Worked example: total revenue where Region = "West" and Quarter = "Q3":
SUMIFS(Revenue, Region, "West", Quarter, "Q3")Say this distinction out loud unprompted in an interview — "the sum range comes first in SUMIFS, last in SUMIF" — and you've already signaled you've actually written these formulas under real conditions, not just read about them.
How do COUNTIF and COUNTIFS work?
Same pattern, but for counting matching rows instead of summing a value:
COUNTIFS(criteria_range1, criteria1, [criteria_range2, criteria2], ...)Example: how many orders were both Status = "Delayed" and Region = "East":
COUNTIFS(Status, "Delayed", Region, "East")A common follow-up: "How would you count unique values matching a condition?" The honest answer in classic Excel is that COUNTIFS alone counts rows, not distinct values — you'd combine it with SUMPRODUCT and 1/COUNTIF(...), or in modern Excel, just lean on UNIQUE plus a COUNTIFS wrapped around it, or a pivot table with "Distinct Count" as the summary type. Knowing that the simple function has a real limitation — and naming the workaround — is the signal.
What does IFERROR actually do, and where does it go wrong?
IFERROR(value, value_if_error)IFERROR catches any error — #N/A, #DIV/0!, #VALUE!, #REF! — and returns a fallback instead. It wraps around a formula:
IFERROR(VLOOKUP(A2, Table, 4, FALSE), "Not found")The trap interviewers love to probe: IFERROR can hide real bugs. If your VLOOKUP is wrong because of a typo in the lookup table — not because the value is genuinely missing — wrapping it in IFERROR will quietly swallow that and show "Not found" everywhere, making the actual bug invisible. The mature answer: use IFERROR for genuinely expected missing-data cases, not as a blanket suppressor slapped on every formula to make red triangles go away. If you want to catch only the "not found" case and let other errors surface, IFNA is the narrower tool.
What's the difference between absolute and relative cell references, and why does it matter when copying formulas?
A relative reference (A2) shifts when you copy the formula to a new cell. An absolute reference ($A$2) stays locked. A mixed reference ($A2 or A$2) locks only the column or only the row.
This matters constantly in practice: copy a SUMIFS formula down 500 rows where one of the criteria ranges should always point at the same lookup table, and forgetting the $ locks means row 2's formula points at the right table, but row 50's formula has silently drifted 48 rows down into empty cells — producing zeros that look like real data. Naming this exact failure mode, unprompted, is one of the highest-signal things you can say in an Excel interview, because it's a bug everyone who's used Excel for more than a month has shipped at least once.
What are some other formulas worth knowing?
- TEXT() — formats a number/date as a string for display.
- TEXTJOIN — joins text with a built-in delimiter, skipping blanks, replacing older CONCATENATE.
- TRIM — strips extra spaces, the single most common fix for "why isn't my VLOOKUP matching" when data was pasted from elsewhere.
- LEFT/RIGHT/MID — substring extraction, common in cleaning concatenated IDs or codes.
- IFS — replaces deeply nested
IF(IF(IF()))chains with a flatter list of condition-result pairs. - UNIQUE, FILTER, SORT — newer dynamic array functions that spill results across cells automatically, increasingly expected knowledge in 2026 interviews.
Pivot table questions and a worked example
If lookups test "can you join data," pivot tables test "can you summarize it." This is usually the part of the interview where you're actually handed a real dataset.
Walk me through how you'd build a pivot table from this sales data
Say it out loud as you go, in this order — interviewers are listening for the sequence, not just the destination: select the data range (or confirm it's an Excel Table first with Ctrl+T, so the source auto-expands later); insert a PivotTable into a new worksheet, keeping the raw data untouched; drag the dimension you're grouping by into Rows; drag the metric into Values, confirming it defaulted to "Sum" and not "Count"; add a second dimension to cross-tabulate; add a Filter field or Slicer for interactive filtering; and finally sort the Rows by the Values column descending — the step people forget, and the difference between a pivot table and an answer.
What's the difference between a pivot table's "Sum," "Count," and "Average" summary types, and when would each be wrong by default?
Excel guesses the summary type based on the data in the column you drop into Values: numeric columns default to Sum, anything with a single blank or text value defaults to Count. This is a real trap — drop a Revenue column that has one row where someone typed "TBD" instead of a number, and your entire pivot table silently switches to counting rows instead of summing dollars, with no warning. Always glance at the field's summary type after adding it.
How would you calculate a percentage of total inside a pivot table?
Right-click the Values field → Show Values As → % of Grand Total (or % of Column/Row Total). This is the "I actually know the tool past the basics" answer — most people instead build a separate formula outside the pivot table to do this manually, which is slower and breaks the moment the pivot table refreshes.
What's a calculated field, and when do you need one?
A calculated field lets you create a new metric inside the pivot table using existing fields — e.g., Profit Margin = SUM(Profit) / SUM(Revenue), built via PivotTable Analyze → Fields, Items & Sets → Calculated Field. The key nuance: a calculated field operates on the aggregated totals, not row-by-row — so AVERAGE(Margin per row) is mathematically different from SUM(Profit)/SUM(Revenue) for the whole group, and conflating the two produces a subtly wrong number that looks completely plausible.
Data cleaning and "this spreadsheet is a disaster" scenarios
This is the part of the job nobody puts on a slide deck, and it's exactly what interviewers want to see you handle calmly.
How would you find and remove duplicate rows?
Data → Remove Duplicates, selecting which columns define a "duplicate." Before clicking it, the better instinct to state out loud: "I'd first use a COUNTIFS or conditional formatting to see how many duplicates exist and on what column, so I understand what I'm about to delete before I delete it irreversibly." Excel's "Remove Duplicates" doesn't ask for confirmation per row — it just deletes, so a quick sanity check first is the professional habit, not paranoia.
A column of dates is being read as text, not real dates. How do you fix it?
This happens constantly with exports from other systems. Fixes, roughly in order of how often they work: Text to Columns with no delimiter change, just clicking through the wizard, which often forces Excel to re-parse the column as dates; =DATEVALUE(A2) in a helper column, then paste values back over the original; or, for unusual formats, constructing a real date from substrings with =DATE(LEFT(A2,4), MID(A2,5,2), RIGHT(A2,2)). The interview signal here is recognizing the symptom — dates left-aligned instead of right-aligned, date math failing silently — before you're told what's wrong.
How do you handle inconsistent text — e.g., "USA", "U.S.A.", "United States" all meaning the same thing?
Name the real options and their trade-offs: a manual Find & Replace for a small, known list of variants; an XLOOKUP against a small "standardization" mapping table for a larger list; or, for genuinely messy free text, Power Query's Group By to surface every distinct value first so you can see the full scope of the mess before touching anything. Jumping straight to fixing without first seeing the full list of variants is how you fix 80% of cases and miss the weird ones that break a downstream report two weeks later.
What's your process when you're handed a spreadsheet you've never seen before?
A strong answer, in order: scan structure first (sheets, merged cells, hidden rows/columns, frozen panes); check column headers and data types against a few spot-checked cells; look for blanks and #N/A/#REF! errors via Ctrl+G → Special → Blanks or a quick filter; sanity-check totals against what you'd expect given the row count; and only then start building formulas or pivot tables on top of it.
Charts and visual storytelling questions
How do you decide which chart type to use for a given dataset?
The honest, simple framework: comparison across categories → bar/column chart; trend over time → line chart; part-to-whole composition → stacked bar (pie charts only for very few categories — more than 4-5 slices and a pie chart becomes unreadable); relationship between two numeric variables → scatter plot. Naming this framework, rather than just "I'd use a bar chart," shows you think about charts as communication, not decoration.
What makes a chart misleading, and how do you avoid it?
A truncated y-axis that doesn't start at zero, exaggerating small differences into apparent dramatic swings; dual axes with mismatched scales making unrelated trends look correlated; too many data series crammed onto one chart, burying the actual point. The fix in every case is the same instinct: ask "what's the one thing I want someone to take away from this chart in five seconds," and strip everything that doesn't serve that.

How to survive a live Excel skills test (screen-share format)
Plenty of analyst interviews include a 15-30 minute segment where you share your screen and work through a real (or realistic, sanitized) dataset live, with the interviewer watching and sometimes interjecting. This format has its own etiquette that has nothing to do with Excel skill and everything to do with not freezing.
Narrate before you click. Say "I'm going to insert a pivot table here to summarize by region" before you do it, not after. Silent clicking reads as either uncertainty or showing off — neither is the impression you want, and narrating gives the interviewer a chance to redirect you before you've gone five minutes down the wrong path.
If you don't remember exact syntax, say so and reason through it. "I don't remember if range_lookup defaults to TRUE or FALSE in VLOOKUP, so I always type FALSE explicitly to be safe" is a better answer than confidently guessing wrong. Interviewers are grading judgment under uncertainty, not perfect recall — the same instinct that matters in a verbal mock interview, which is exactly why practicing out loud (not just reading formulas silently) is the actual skill being tested. It's a big part of why we built Greenroom as a voice-first tool rather than a flashcard app — the muscle you need in this round is talking through your reasoning live, under mild time pressure, which silent reading simply doesn't train.
Sanity-check your own number before presenting it. If a pivot table says total revenue is $4.2 and every other number on the sheet is in the thousands, say "wait, that looks wrong, let me check the summary type" out loud — catching your own mistake in real time is a stronger signal than getting it right by luck the first time.
Ask clarifying questions before diving in, the same way you would in a real job: "When you say 'underperforming,' do you mean below target, below last quarter, or below the regional average?" A precise definition up front saves you from confidently solving the wrong problem for five minutes.
Manage the clock out loud. If you're 10 minutes into a 15-minute segment and not done, say so: "I'm going to simplify my approach given time — instead of a fully dynamic dashboard, I'll get you the core numbers first." Interviewers would much rather see you triage under a deadline than watch you silently run out the clock on something elaborate and unfinished.
Excel vs. Google Sheets vs. Power BI vs. SQL — what each interview actually wants
Worth addressing directly, because it comes up: "Why are we still testing Excel when there's Power BI / Tableau / SQL?" Excel wins on speed for ad hoc, one-off analysis and is still the universal hand-off format between teams that don't share the same BI tooling — a .xlsx opens for literally everyone. Google Sheets has near-identical formula syntax but adds real-time collaborative editing, which Excel only recently caught up to. Power BI / Tableau win for recurring, refreshable dashboards meant for a non-technical audience to self-serve — see our Power BI interview questions and Tableau interview questions guides if those are also on your interview slate. SQL wins the moment the dataset stops fitting comfortably in a spreadsheet, or multiple people need to query the same source of truth — our SQL interview questions guide covers that side.
A strong answer to "why still Excel" isn't defensive — it's something like: "Excel is still where messy, first-look analysis happens before it's worth the overhead of a formal pipeline. Knowing when a question deserves five minutes in Excel versus a proper SQL query or a Power BI model is its own skill."
It's also worth being honest about how people actually prepare for this, because interviewers have heard every version of it: a GeeksforGeeks-style page of 50 Excel functions to memorize, a friend's WhatsApp-forwarded PDF of "Excel interview questions," or typing the same questions into ChatGPT and reading the answers silently. All three get you the facts. None of them put you under the actual condition you'll face in the room — someone watching you reason live, with a clock running. That gap is exactly what a voice-based mock, talking through a pivot table build or a VLOOKUP failure out loud the way you would on a real call, is built to close.
Practice it out loud, not just on paper
Reading this guide gets you the facts. The part that actually fails people in the room is reasoning through a pivot table or a broken VLOOKUP live, while talking, with someone watching. Greenroom runs voice-first mock interviews that put you through exactly that pressure beforehand — so the real thing is the second time you've done it, not the first. Pair this with data analyst interview questions, business analyst interview questions, and Tableau interview questions to cover the rest of the loop.
Frequently asked questions
Do I need to memorize exact Excel formula syntax for an interview?
Mostly no — interviewers care far more about whether you know which function solves a problem and why it's the right one than whether you have the exact argument order memorized. Saying "I'd use SUMIFS here, and I'd double check the sum_range comes first" is a stronger answer than silently guessing and getting an argument order wrong.
What's the single most common Excel interview question?
Some version of "VLOOKUP vs. INDEX-MATCH" (and increasingly "vs. XLOOKUP") comes up in nearly every Excel-focused interview round. Knowing all three, their trade-offs, and a clear personal default is the highest-leverage thing to prepare.
Is Excel still relevant if a company uses Power BI or Tableau?
Yes — most companies that have Power BI or Tableau for finished dashboards still use Excel constantly for ad hoc analysis, one-off requests, and as the universal file format for sharing data with people outside the analytics team. Interviewers test Excel because it's still the daily tool for a large share of analyst work, regardless of what the polished dashboard layer is built in.
How long does an Excel skills test usually last in an interview?
Typically 15 to 30 minutes, often screen-shared, working through a realistic (sometimes sanitized real) dataset with a specific business question to answer — not a written quiz, a live working session.
What should I do if I don't know the answer to an Excel question?
Say what you do know, name the gap honestly, and reason through it out loud rather than guessing silently. "I'm not sure of the exact function name, but I know I'd want to count distinct values matching a condition — I'd look at COUNTIFS combined with something to dedupe, or just build a quick pivot table with Distinct Count" shows real problem-solving even without perfect recall.
What's the difference between a formula and a function in Excel?
A function is a predefined operation like SUM or VLOOKUP. A formula is the full expression typed into a cell, which may combine one or more functions — e.g., =IFERROR(VLOOKUP(A2, Table, 4, FALSE), "Missing") is one formula built from two functions. Interviewers occasionally use this distinction to check basic fluency, not as a trick question.